Demographics of Gerry's Neighborhoods
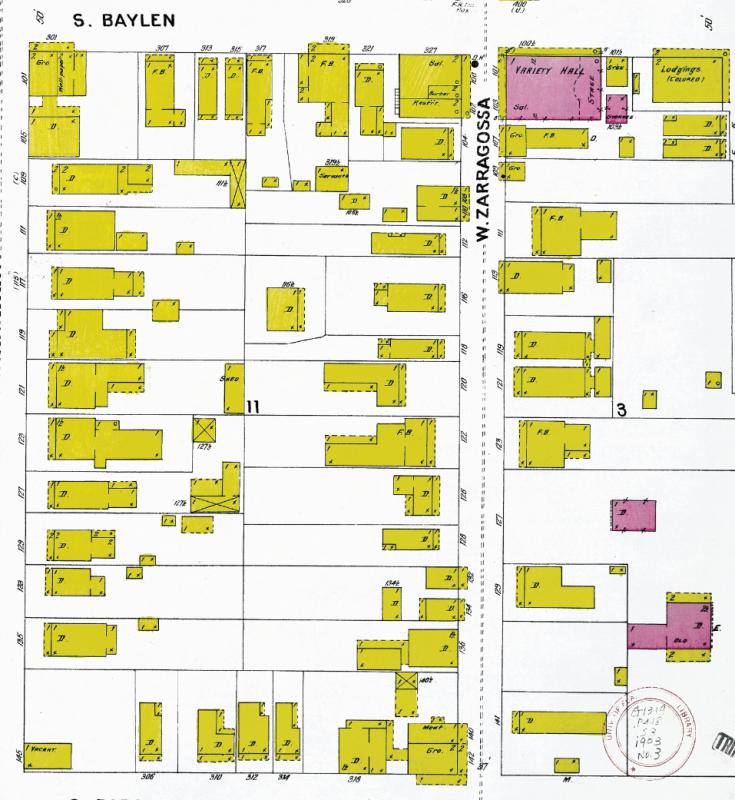
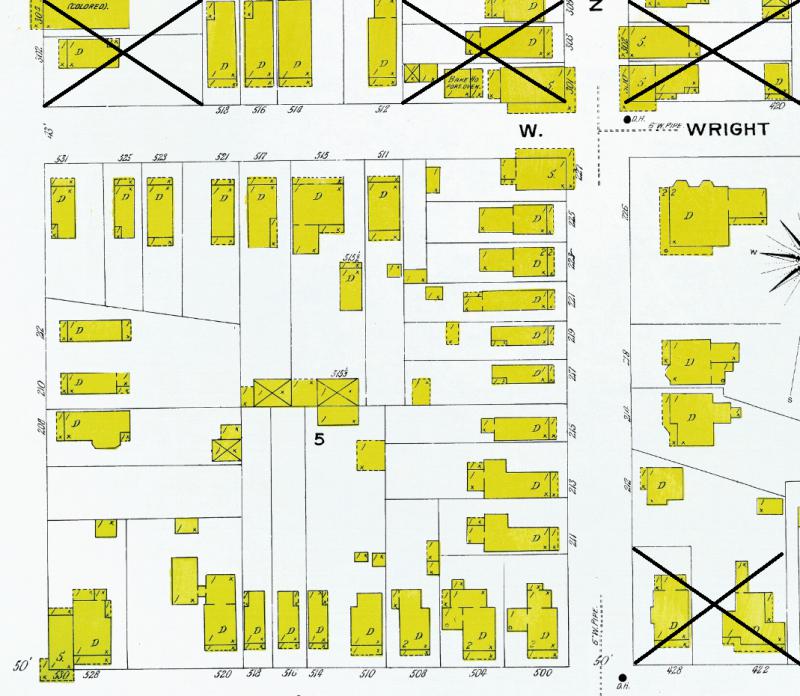
According to the areas covered by the demographic surveyed, white people typically owned the larger houses, though some do live in smaller folk and shotgun style housing. That's not to say that there were no african americans who owned larger houses, but within the areas that were surveyed this is not the case. The neighborhoods are relatively integrated in the poor sections (Gerry’s neighbor at 511 W Wright is white). The surveyed sections of W Government and N DeVilliers are completely comprised of white inhabitants. The only exception being a small house at 145 W Government which was inhabited by an african american man in 1900 but was vacant by 1903. The most common type of house in both neighborhoods were shotgun style houses. This indicates that Gerry lived in an average house for all three houses because all of his houses were shotgun style housing.
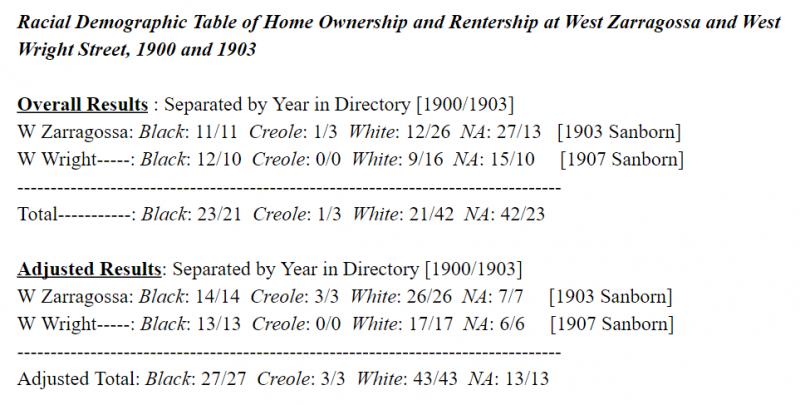
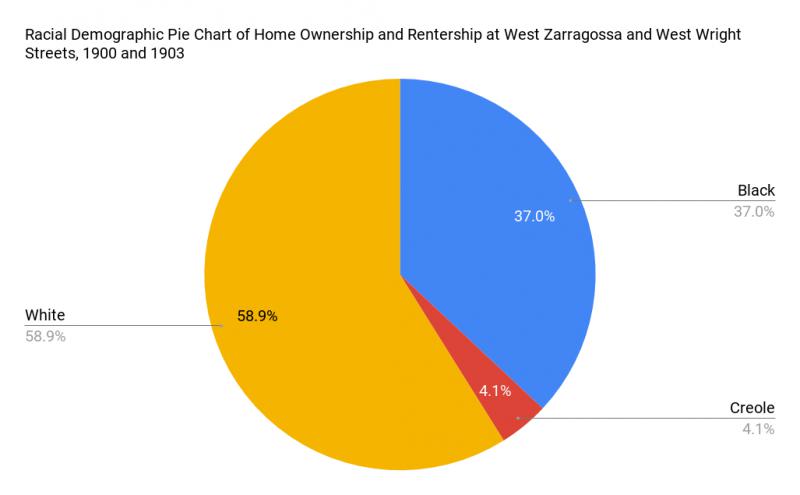
In the course of creating this demographic survey, an interesting pattern started to take shape. That is that the ethnicity of the owner/renter of a house almost always remains the same despite the ownership/rentership changing between 1900 and 1903. In other words, if a white person lives in 118 W Zarragossa in 1900 than its is highly likely that a white person will still be living there in 1903 even if it is a different person. Out of the 87 houses surveyed only 3 of them break this pattern. So, there is about a 3% chance that the ethnicity of an owner/renter changes at all. A glance at the 1905 and 1909 city directories offer further corroboration. Also of the 87 houses surveyed, 34 of which do not have any N/A marks for both 1900 and 1903 and of the 34 houses, 3 of them have the racial switch, making it about a 10% chance of this switch occuring when accounting for the N/A result for either year. That being stated, it can be assumed that most entries with N/A for one year and an ethnicity for the other year, that the N/A is the same enthicity. So, a corrected chart can be deduced from this observation. However, with such a limited sample size the information should be observed with caution.
According to the 1900 census the white population of Escambia is 16,884 and the black population is 11,925. Which means in 1900 there was 4,959 more white people in Escambia county then there were black people. This is a 0.71 ratio or about 3 black persons to every 4 white persons. In 1900, african americans make up about 41% of the entire population of Escambia county. This is significant because this ratio and population percentage almost mirrors the ratios and percentages of the two neighborhoods in the demographic survey. The ratio in the neighborhoods is a 0.70 or about 3 black persons to every 4 white persons and african americans make up 41% of the population in the two neighborhoods. [For this calculation creoles were added to the black population due to their small number and similar marginalized status] What this means is that Gerry’s neighborhoods closely resembled, at least ethnic population wise, closely to Escambia county as a whole. While this differs a bit from the microlevel of each neighborhood the proportions are still very similar. For W. Zarragossa the ratio is 0.65 and the African American population is 40%; and for W. Wright the ratio is 0.76 and the African American population is 44%.
With this statistical information it is safe to say that Gerry appeared to live in an average arrangement for someone of his economic class. He lived in multiple shotgun houses throughout his time in Pensacola, his neighborhoods were racially and economically diverse and were good representations of Escambia county as a whole.


