
Our inventory includes a great deal of information carefully selected for its connection to Escambia County and coastal heritage. This data is presented in a single tool allowing users to customize their research experience according to their own interests. These instructions will help you get the most out of this site as you tour Escambia County’s rich coastal heritage resources. Click here if you’re ready to explore!
Date Slider
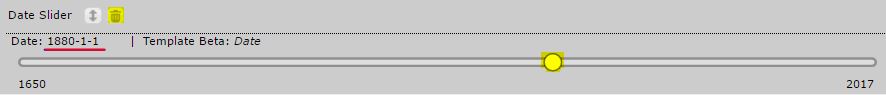
The slider at the top of the viewer acts as a timeline, where you can view sites that existed on a specific date. The default date for our timeline is 1 January 1880. To adjust the date, simply click and drag the slider cursor using your mouse. You will see the date adjust on the left-hand side of the slider.
To view all of our inventoried sites at once, you can turn off the slider option by clicking on the “Delete Filter” button/Trashcan Icon.
Viewing Sites
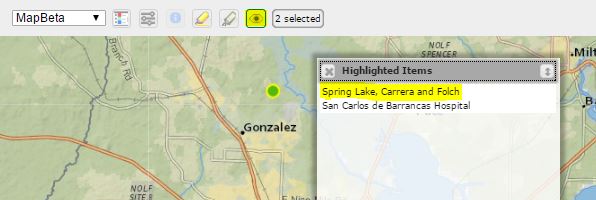
To view a site, click on one of the map points. This will highlight the site, and its name will appear in the Highlighted Items box. You can select as many sites as you want at a time. Sites can be deselected by clicking on them a second time.
From here, you can access more information about the site in one of two ways. You can either click on the flashing eye icon, located in the toolbar; or, you can click on the site’s name in the Highlighted Items window. Either of these actions will bring up an Inspector window with more information. 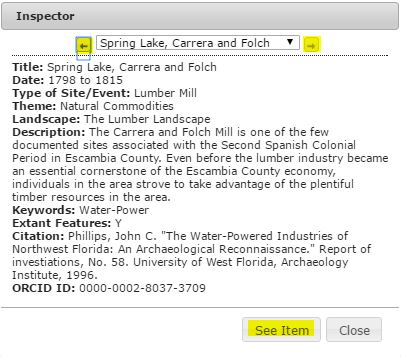
If you have multiple sites selected, you can scroll through each site by click the left or right arrows at the top of the Inspector window.
Each site has an individual page, which may include more information, or even a photo. You can access the site page by clicking the See Item button located on the bottom of the Inspector window.
Map Versus Timeline Viewer
![]() Using our Prospect visualizer, you can view our inventory as a map, a timeline, or both. The default view is set to Map Beta. To view the inventory as a timeline, navigate to the drop down menu at the top left hand corner of the page, and select Timeline Beta.
Using our Prospect visualizer, you can view our inventory as a map, a timeline, or both. The default view is set to Map Beta. To view the inventory as a timeline, navigate to the drop down menu at the top left hand corner of the page, and select Timeline Beta.
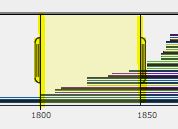 Your timeline viewer can be controlled using the Zoom Frame, located at the top of the timeline display. Use your mouse to click anywhere inside the Zoom Frame, and drag the “handles” to adjust your timeline’s viewer window.
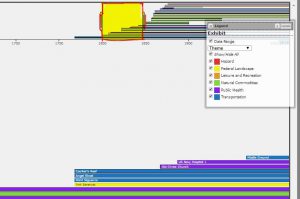
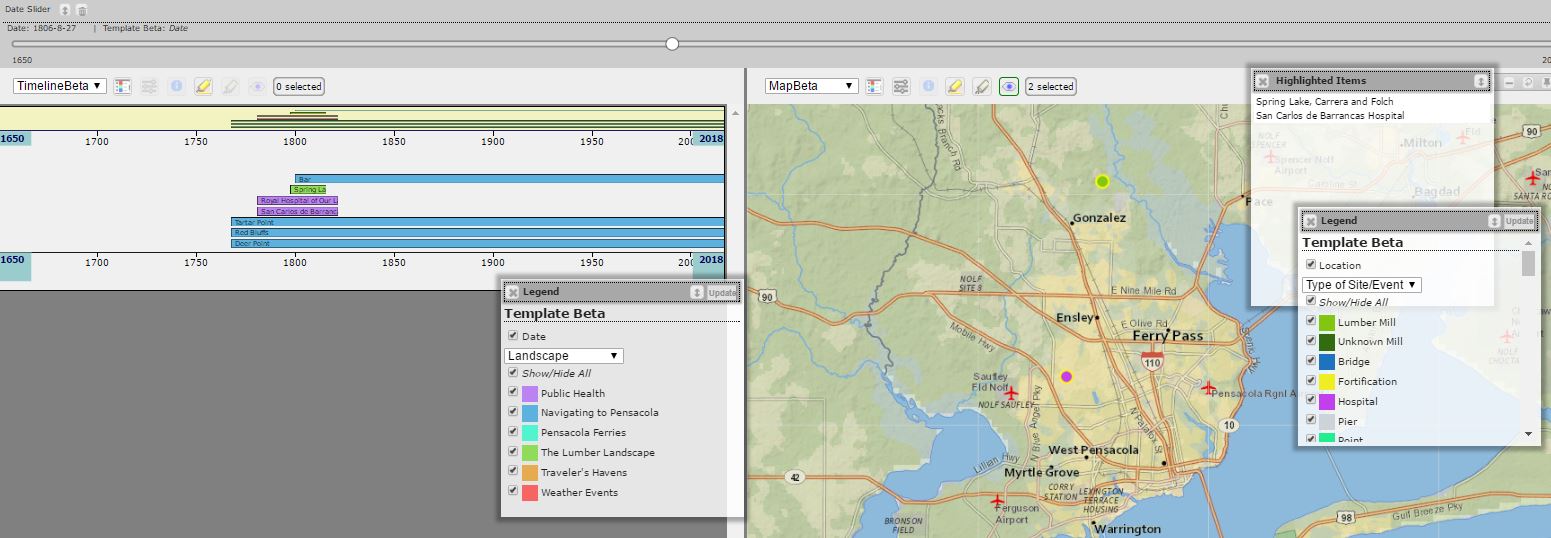
You can view maps and timelines at the same time by clicking the “Show/hide View 2” button at the top of the viewer. Simply click the button, and your map and timeline will appear side-by-side. To return to a single view, click the “Show/hide View 2” button again.
![]()
In split-screen mode, you are able to adjust each view separately. This way, you can compare two timelines, a timeline and a map, or two maps by independently adjusting their Filter settings.
Filter Settings
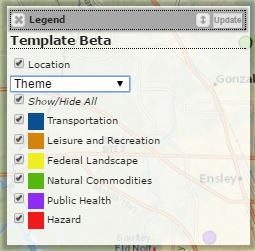 Filter settings allow you to view sites based on categories and types, depending on your interests. Our current filter settings are Theme (default), Landscape, Type of Site/Event. All of our themes can be adjusted in the Legend window. To toggle between themes, you will use the drop down menu. To activate or deactivate a theme category, simply check or un-check the box located next to each category.
The Theme category sorts each site into overarching motifs. Some sites might be characterized by more than one Theme. For instance, a Ferry might be categorized as both Transportation, and Leisure and Recreation. Thus, the Ferry site will be visible as long as you have one or both of these Theme categories turned on.
Each Landscape theme was developed by one of our researchers, and displays all of the sites that fall into their line of research. To learn more about our Landscapes, click here.
Site/Event Type color codes and displays sites and events based precisely what type of site they were. Using this feature, you will be able to visually discern between a hotel, inn, or lodge; or, you can view weather events and determine whether a point represents a hurricane, tornado, or snow storm.
Coming Soon!! – Map Layers
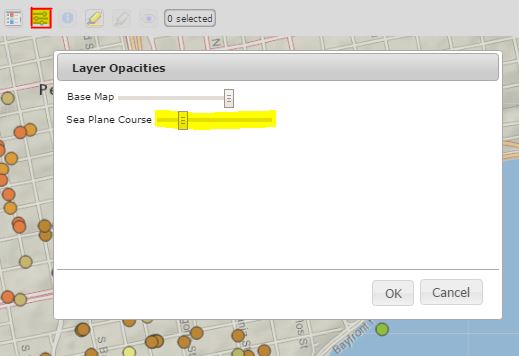 You will be able to view different map overlays by simply adjusting their opacity. Map Layers can be found by clicking the View Options button, which will produce a Layer Opacities window. Select which map layer you would like to view, and adjust its visibility by dragging the slide bar.
Ready to visit our Interactive Map?